


Exchange Server 2019 Monitoring Best Practices. Monitoring is the cornerstone of effective IT management, regardless of server location. Be it within a data center or in the cloud. While routine server performance and availability metrics remain essential, certain workloads like Exchange Server 2019 demand a specialized approach to monitoring for optimal functionality and reliability.
In this article, we delve into the critical best practices essential for Exchange Server 2019 monitoring. From service monitoring to database health, client access, transport, and beyond, this comprehensive guide provides insights into monitoring these specific facets of Exchange Server operation. Let’s explore the key areas that warrant meticulous attention to ensure the smooth functioning of Exchange Server 2019.
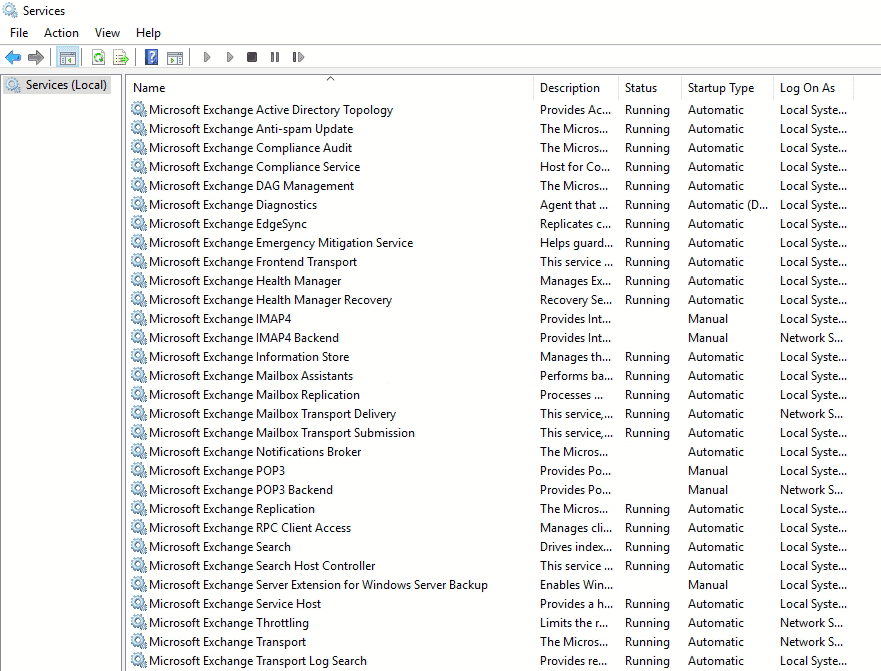
First Things First - Service Monitoring
First of all, Exchange Server services statuses must be monitored as a “must have”.
The services to be monitored
- All services which names start with “Microsoft Exchange …”, excluding Microsoft Exchange Server Extension for Windows Server Backup (only active during the backup), Microsoft Exchange Notifications Broker (it works for a short period after the server startup, then stops) and other services not used by the company (e.g. POP3 and IMAP services if these protocols are not used in the company).
- World Wide Web Publishing Service, responsible for IIS web server. In case of a failure of any service, administrator should get a notification ( email or a phone text message). If you use email messages, the means of delivering notifications is worth noting. You shouldn’t rely on Exchange Server to deliver messages about its unavailability. Use a third-party messaging solutions for this purpose.
Additionally, as Exchange heavily depends on Active Directory Domain Services, the connection between Exchange Servers and Domain controllers should be kept a check on, for example, using the counters shown here.
Ensuring Data Availability - Mailbox Database Monitoring
For servers that hosts the mailbox databases, consider monitoring the following:
Available disk space – the growth of the database and transaction log files cannot always be predicted. Sometimes you run out of disk space when you don’t expect it. Additionally, when your database grew, simple movement of mailboxes to another database on different disk won’t allow you to release the free space (the database remains the same size). Therefore, when your disk run out of space you face the following issues.
Problems when the database disk is full
- Mailboxes within this database don’t function.
- Release of free space requires long procedure of database defragmentaion using Eseutil tool (personally, I prefer not to perform defragmentation at all – it is easier and faster to move all mailboxes to another database, remove the existing one and create a new database from scratch).
As a result, it brings long outage of the service and makes the monitoring of free space highly critical.
Additionally, it is a good practice to create 10-20gb of dummy files in the disk (for example, using PowerShell). In case of unexpected issues with storage space availability you remove them and bring mailboxes online.
If you don’t use circular logging, the transaction logs for your databases will grow until the successful backup of the database, and after the backup the logs are truncated. Therefore, in case of the backup failure, you should expect the significant growth of the transaction logs. It is important to monitor the backup completions status.
Database status
Admin shall be notified when the database state become Unmount. Besides, in case you have database availability group (DAG), ensure that unexpected fail overs of databases from one server to another are recorded and alerts are sent. Don’t ignore the status of the passive database copies, they always should have Healthy status (especially if you have only two copies of the database).
Database Operations Read/Write Latency
If the latency becomes too high, disk drive IOPS probably can’t cover the current workload. Microsoft provides significant amount of counters (found in the official article) to be used to monitor this parameter (the article is about Exchange Server 2013, however, the same counters are available in the newer versions).
Note, active and passive database copies have different types of load (active copies have large number of read operations, while passive copies – of write operations). Therefore, it is a good practice to combine active and passive copies of different databases on the same drive, to reduce the number operations spikes.

DAG-specific Parameters
In case you have DAG, monitoring of additional metrics should be considered. Database replication copy queue length demonstrates the replication health – if the queue is too long, there could be network or disk I/O issues. Witness server and alternate witness server availability should also be monitoring to ensure that in case of disaster the cluster acts as expected.
Try our Active Directory & Office 365 Reporting & Auditing Tools
Try us out for Free. 100’s of report templates available. Easily customise your own reports on AD, Azure AD & Office 355.
Securing Mailbox Accessibility - Client Access Service Monitoring
To ensure that users access their mailboxes, monitor these client access-specific parameters.
Virtual Directory Health
Exchange Server Virtual Directories should be monitored using HTTP health checks. Different directories provide different features, therefore all of them should be monitored. For example, OAB directory unavailability causes issues with address book download, EWS unavailability – issues with out-of-office responses, Teams calendar (if it is integrated with Exchange), and other services, MAPI virtual directory failure prevents users from accessing mailboxes using Outlook, etc.
Network Port Availability
Most of the Exchange services use HTTPS and are usually monitored by HTTP health checks. If other protocols, such as IMAP and POP3, are also used in your organization, their availability should also be checked.
TLS Certificate Expiration
Expiration of the TSL certificate installed on IIS service will cause connection issues for the end users. It is important to replace the expiring certificate in advance. Do it by listening for Windows Server Event ID 64 – it is recorded as a warning when the certificate reaches 90% of its lifecycle.
Confirming the Deliverability - Transport Service Monitoring
It is also important to keep track of the transport system of Exchange Server.
SMTP port availability – admin should be notified when the ports used for email transport become unavailable. Standard SMTP port is TCP 25, ports 587 and 465 are also usually used, for SMTP relay purpose.
Message Queue Length is another important metric for the transport monitoring. It shows the number of messages that waits their turn to be processed and sent. There are different types of queues in Exchange Server, as you can see in Queues and messages in queues in Exchange Server.
Queue types
- Delivery queues responsible for message delivery to the recipients. If the queue becomes too long, there is probably some issue with the transport (port is closed, some of the smart hosts is unavailable, etc.) or with performance (network performance or server performance is too low for the messaging workload).
- Poison message queue contains messages that could be potentially harmful for the server. It is typically empty, and if any message ends up in this queue it remains there until manually processed by the administrator.
- Shadow queues are the part of the Shadow redundancy feature of Exchange Server (more details found here) and they store messages until they are successfully delivered to the internal recipients. If one of the shadow queues become too long, it may demonstrate the unavailability of one of the DAG member servers.
- Submission queue designed to store messages that weren’t processed yet. If its length growth, there are probably issues with the local server.
- Unreachable queue contains messages that cannot be delivered to their destination. If many messages end up here, it is a signal to check the routing configuration.
- External message processing system monitoring – in case the any external system (anti-spam solution, smart host, data-loss prevention system, etc.) is used for routing the messages, its health also should be monitored. For example, if you use on-premises Exchange Server and Exchange Online Protection as a email filtering solution (Standalone Exchange Online Protection approach) or use Exchange Hybrid deployment, issues on the cloud side affects the mail flow. In this case, subscribe to the service health alerts and to planned maintenance events in Microsoft 365 Message center.


Exchange Server 2019 Monitoring Best Practices Conclusion
Exchange Server 2019 stands as a vital component in many organizations’ communication infrastructure. To maintain its seamless operation and ensure uninterrupted service, diligent monitoring practices are indispensable.
By adhering to the best practices outlined in this guide, administrators proactively monitor Exchange Server services, mailbox databases, client access, and transport systems. Vigilant oversight over critical parameters such as service statuses, database health, client access functionality, and transport metrics guarantees prompt identification of issues and facilitates swift remediation.
Try InfraSOS for FREE
Try InfraSOS Active Directory, Azure AD & Office 365 Reporting & Auditing Tool
- Free 15-Days Trial
- SaaS AD Reporting & Auditing Solution
Related posts:
- Repadmin: Check Active Directory Replication / Health
- Windows Server Patch Management: How to Keep Windows Server Secure & Up-to-Date
- Office 365 Exchange Online: Set Up and Manage Exchange Online
- Create Active Directory Exchange Reports with PowerShell
- Secure Your Data with Windows Server Encryption & BitLocker